EQ-search tool manual
Contents
Introduction
The EQ-search tool is an application which can be used to search earthquakes and certain other seismic events from the local catalogue of the Institute of Seismology at University of Helsinki. Local means pretty much all of Northern Europe from 50th latitude upwards, with a focus to Fennoscandia.
The purpose of the application is to offer a more intuitive way of searching and browsing through a text based list catalogue. You can find the original – and quite cumbersome to use – catalogue here (goes to the institute's site).
The verified catalogue contains earthquakes from the 14th century onwards up to year 2014. More recent data will be made available, but can't be considered absolutely accurate and is subject to change (see the Cat. only option under the Configuration section). The source for the most recent events is this public list provided by the Institute.
Note that the preliminary data (in green, violet and blue) may have errors as stated in search tool after you have done a search.
All the pictures used on this manual depict the same search situation. This means that search parameters, map location, highlighted row, open infobox, etc. are all linked, e.g. when the manual talks about how highlighting a row opens up an infobox you see in practice what it means. The pictures might be bit outdated, but all of the main components will remain unchanged.
Also, in case you need quick help the interface has many tool tips which you can access by letting a cursor hover over an item. If your device doesn't support hovering, more comprehensive info is always available in the manual.
Please consult Institute of Seismology before using data for research or commercial purposes.
Back to topQuick guide
- Set the search location by dragging or clicking the circle.
- Click search.
You can resize the circle by changing Circle radius in the query form.
This will produce a search of all the events (no magnitude filter) in the past 50 years.
In case dragging the circle feels inaccurate, you can also click on the map to set the coordinates, and if that's not enough, you can just type the desired search coordinates manually.
For more complex scenarios I suggest experimentation and if you get stuck then the manual...
One more thing... Many of the components or links in the EQ-search interface have tooltips. So if you need quick help (or a snarky remark) then just let the cursor hover over an item.
Back to topSearch
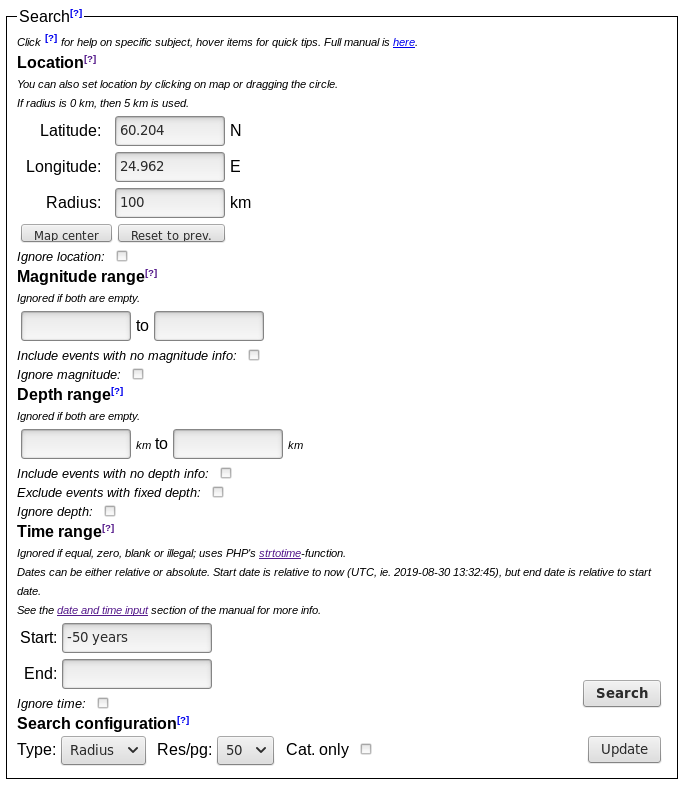
The EQ-search tool provides multiple ways of narrowing down the desired events. In short you can filter events by their location, magnitude and time. Details of the various methods are listed below.
In most cases the order of ranges don't matter (eg. magnitude range of 1.0 to 1.6 is functionally equal to 1.6 to 1.0), but there are some exceptions mostly concerning open ranges (an example of an open magnitude range is pictured above) which are explained in detail in the subsections below.
In order to start a search just click the Search button on the interface. You can also start a search by pressing enter while typing in one of the parameter boxes.
The Update button is related to the configuration section, but it basically just updates the search type (and resets the map to coordinates set under Location).
- Map center button will make the longitude and latitude of the search location point to the center of the map. This is especially useful when you can't properly drag the shader or accurately double click on the map (eg. mobile device).
- Reset to prev. resets the map & search to the location of previous search or update. The zoom level remains unchanged, but you will be returned to default zoom after performing a new search.
You should also check the section concerning map window for further information.
Back to topLocation
Perhaps the most important way of narrowing down the events is by their location. Because of its importance the application offers several ways of performing location searches.
Currently the available types of location searches are by a radius around a center point (Radius search), a latitude & longitude window around a location (Window search) and by manually setting latitude and longitude limits (Box search). Functionally the latter two are identical, but the interface is different. For help on how to change the location search mode see the configuration section.
One important consideration is the format of the coordinates. Specifically the application only accepts coordinates that are entered in decimal degree format using a '.' as the decimal separator.
It is good to note that because the source material reaches back half a millennium some of the locations might be off by a considerable margin.
Back to topRadius
The default location search type is the Radius search. It is relatively simple to use: Just enter coordinates into the provided latitude & longitude text boxes and the desired radius.
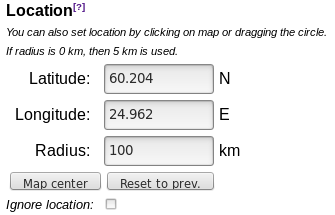
Radius search also supports map interaction so you can set coordinates of circle center by dragging or clicking on the map. The search location will update accordingly.
Radius is handled in 1 km intervals rounded up so, for example, typing 20 or 20.6 in the Radius box will produce identical searches returning events that have happened under 21 kilometers from the given center location. However, the actual shader circle will have an exact value, so some results will appear outside the shaded area. The result list will also have an extra column containing the event's distance to the center point.
Ignore location check box makes the search ignore event's location completely. This is useful when you want to find e.g. all the magnitude 3.1 quakes on the list, but caution is suggested as the length of result list will inflate rapidly if care is not taken.
The two mystery buttons – Map center & Reset to prev. – are explained above.
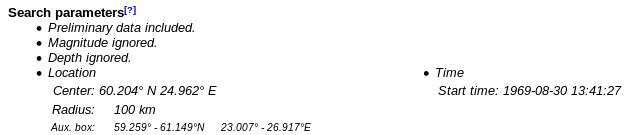
The search parameters will display an extra row called Aux. box, which contains the bounding latitude-longitude box, with an extra 5 km buffer zone, calculated for the circle ie. the entire range should be contained within the box.
Due to various reasons, the radius search is ultimately limited to a box ranging from SW corner of 0°N/-15°E to NE corner of 90°N/90°E. However the radius search will already start working erratically if the latitude of the center point is above 88°. In case you think an event should appear on the result list but it doesn't, you can check the Aux. box to see whether the search happened as expected.
Back to topWindow
Window search works pretty much the same way as the Radius search described above, with several key differences.
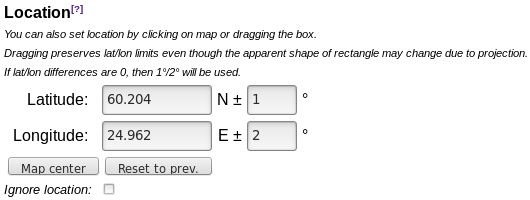
The most important difference is that instead of radius you specify latitude and longitude window around the center point. The window works by adding and subtracting the given window size from the center point so that eg. ± 5° means a 10° search window.
Another issue is the map interaction. Basic functions remain the same – you can still set the location of rectangle by clicking or dragging.
In case you drag the shaded search rectangle to the north or south, the apparent shape of the window size will change even though the limits in degrees remain constant. This is due to the nature of the map projection, which causes the projected length of a latitudinal degree on map to change (length of a longitudinal degree remains constant).
Back to topBox
The last search mode is the Box search. Basically it's a different way of accessing a Window search.
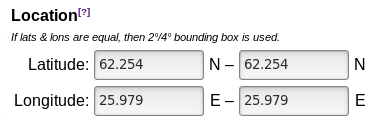
In a sense it's the easiest search to use – just enter the coordinates of the latitude and longitude range you want to inspect and hit the Search button – but because it is assumed that you know the coordinates of the area you want to search there is no map interaction.
You can't drag or adjust the search area using the map in any way. You can only inspect the results or study the map.
This also has some positive side effects as it allows you to use the map normally within the shaded area. In other search modes you would probably change the search location instead of the map location.
If the latitude & longitude are identical then a 2° by 4° box is used. This is functionally equivalent to 1° by 2° window around a center point.
Back to topMagnitude range
Here you can choose the magnitude range of the events you want to see.
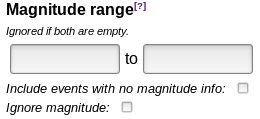
- ...in a range: Just type in the magnitudes in any order.
- ...with a magnitude larger than X: Type the X on the left box (see the picture above).
- ...with a magnitude smaller than Y: Type the Y on the right box.
- ...of a single magnitude: Type the same magnitude on each box.
- ...of any magnitude: Check the Ignore magnitude check box or leave the boxes empty.
The Include events with no magnitude info check box functions only when you have some sort of magnitude filter active. If the check box is marked then the search also displays events with no magnitude data available, even though they wouldn't technically belong into the range.
You can also search only for events without magnitude info by setting the minimum magnitude to a ridiculously high value (eg. 15) and marking the check box.
Another trick you can perform is to dump the entire catalogue into the results. By default, if you try to ignore all the searches the application thinks you've made a mistake, but you can trick the application by leaving the magnitude filter on with a maximum magnitude set to an outrageous value (eg. 15). Just remember to check the Include events with no magnitude info if you want to see all the events.
Back to topDepth range
This new feature allows you to filter events based on their depth. The logic behind the search is similar to other filters (see eg. the section about magnitudes for basics).
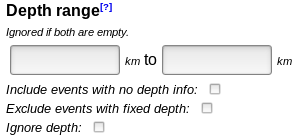
The additional feature is the Exclude events with fixed depth which excludes those events from the list which have their event fixed by a seismologist. The fixing is done for various reasons, for example because the locating software cannot reliably measure depth, the depth it offers is nonsensical with regards to the tectonic setting or because the fixed depth gives a better positioning result over a measured depth.
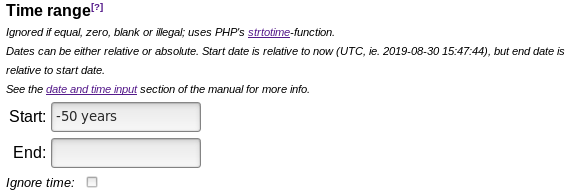
Back to topTime range
This deceptively simple looking piece of interface allows you to control the when of the events you're searching all the way up to a second accuracy. All times are UTC.
The complexity lies in the types of times the application accepts and in how relative dates work, but before explaining them in further a brief explanation of how the various ranges work.
In order to search events in a time range, input start and end times. The order doesn't really matter, except when the dates are relative.
If you want to search events earlier than a specific time, then you must leave Start box empty and type the desired time in to the End box.
Conversely, if you want to search events later than a specific time, then you must leave End box empty and type the desired time in to the Start box.
- Relative to Start time: In case the End time is relative and there is a Start time and it is a valid time (example in the picture).
-
Relative to now:
- Start time is always relative to now (displayed on the interface).
- End time is relative to now if Start time is left blank (or is equivalent to empty or actually is 'now') or Start time is equal to End time.
- Relative to Unix epoch (1970-01-01): In case the End time is relative but the Start time is invalid somehow.
The last exception mentioned in case 2 above means that Start time of any plain date with no specific time works with End time of Today. Other than that, please be careful when using a relative End time. For example Start time of '1900-01-02' and End time of 'Yesterday' means a range of '1900-01-01' – '1900-01-02' while with End time of Today the range would be from '1900-01-02' up to today.
Notice that both dates can be relative but they will (most likely) be relative to different times. For example Start time of -50 years midnight and End time of +50 years would be equivalent to the search window seen in picture above.
Back to topDate & Time input
-
Full dates & times
- YYYY-MM-DD hh:mm:ss – If you need to specify a date, please use this format (ISO standard) with dash as seperator, eg. 1912-03-04 05:06:07
- DD.MM.YYYY hh:mm:ss – However this also works.
- MM/DD/YYYY hh:mm:ss – As does this.
- YYYY–M-D h:m:s – You can use shorthand forms as well, eg. 1912-3-4 5:6:7, but caution is adviced especially if you shorten a year to two numbers (works as "expected" from 1970→)
- YYYYMMDDhhmmss – If you really want to spare letters... (ie. 19120304050607)
-
Partial dates & times
- YYYY – Typing just the year works, eg. 1912. This isn't native to strtotime.
- YYYY-MM, YYYY-MM-DD – These work too.
- DD.MM.YYYY, DD/MM/YYYY – In case you don't want to use the ISO-standard...
- YYYY-MM-DD hh00 – You can't specify just hours (ie. without minutes or date) but adding 00 works eg. 1912-03-04 0500.
-
Other common timespans
- YYYY-WXX, YYYYWXX – Week XX of the year YYYY, eg. 1912W10 for week 10 of year 1912.
- YYYY-WXX-Y – Day Y of week XX in year YYYY, eg. 1912–W10–1, which is infact equal to above.
- YYYY-01-01 +XXX days – (XXX+1) th day of the year, eg. 1912-1-1 +63 days for the 64th day of year 1912.
-
Language skills – Yes, it even supports plain English.
- Now – What the time is right now, server time, UTC.
- Today – Today midnight. Note: This means the start of the day, ie. 00:00 not 24:00.
- Noon, Midnight – Pretty self explanatory
- Monday, Sunday, Tue, etc.. – Not really useful by themselves without other date definers, like for example Mon 1912W10.
- Yesterday, Last week, Last month, etc.. – Work.
- ± XX years, ± XX months, etc.. – Relative dates adding or substracting the given time from Now or Start time (see the bit about relative dates above). Omitting sign equals +.
- Various date texts – Might work. For example March 1912 or Noon March 4 1912 do work.
You can combine some of those with each other, eg. Today noon, +10 days -12 hours or even go completely crazy with dates like Noon March 10 1912 -1 week +1 day -7 hours +7 minutes -53 seconds.
- Start: YYYY-MM-DD
- End: +1 day
For further help, see the manual about strtotime and the list of supported date and time formats.
Back to topConfiguration
Here you can control some aspects of the search.

- Type – You can select the type of location search used from this drop down menu. See the section about location search for further info.
- Res/pg – Results displayed per page. Higher number means slower loading. The map will also look more crowded.
The last option in the Res/pg list – All – will disable paging and return the full list of results at once. However, be warned, if the number of displayed results is too high a browser might become unstable and even crash. The actual number is device and browser dependent but is probably in range of 500-3000 results. In case the the amount of search results is sufficiently high, while All is selected, the application will warn the user and offer an option to search without event circles. - Cat. only ie. catalogue only – Checkbox that controls the scope of the search. If the checkbox is crossed then the search will include only the verified catalogue of events (events up to 2013 as of writing). If it's left unchecked then preliminary data, which covers more recent events, is also included in the search. The newer events will appear slightly differently on the list – text is tinted green – and on the map, where the event circle will have an orange hue.
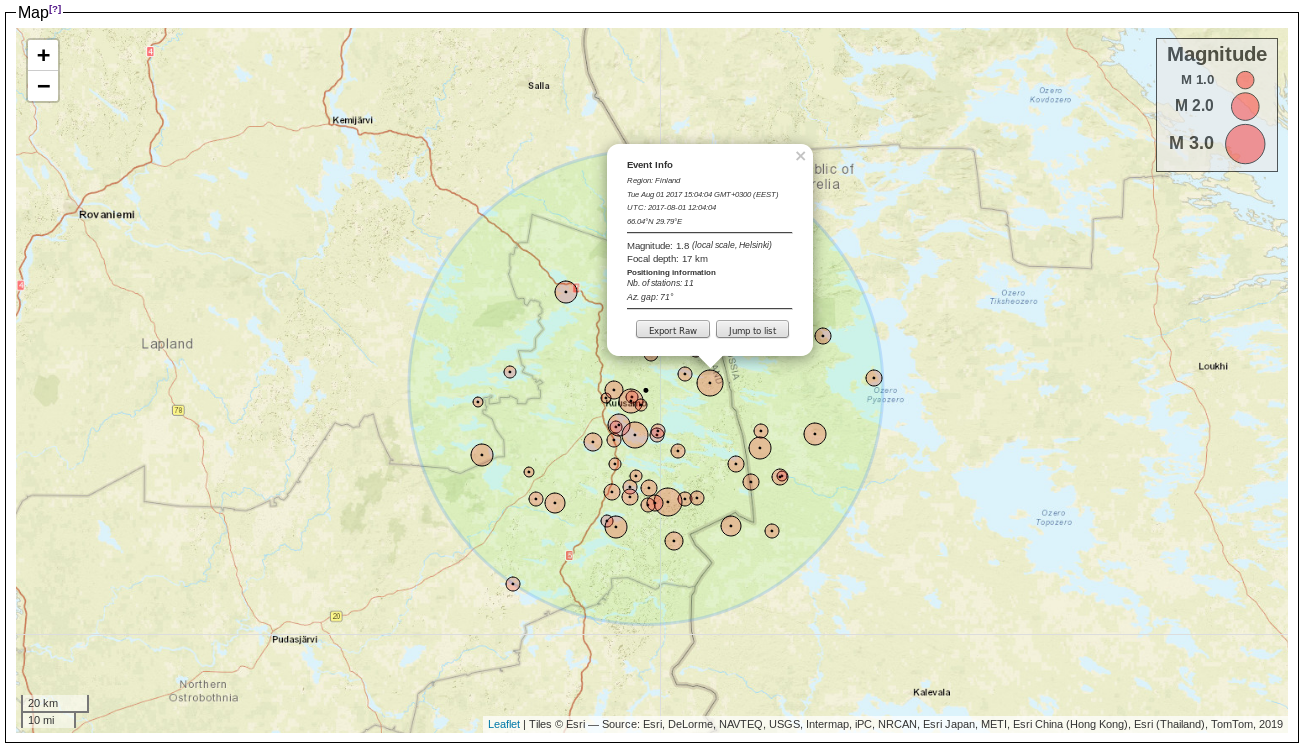
Map
Map is in a way the heart of the application so knowing how it works is important. However, due to differences between browsers and screen sizes, its actual appearance may vary a bit from device to device so this is just a rough reference.
The map itself is a Leaflet map which uses transverse Mercator projection and its coordinate system is WGS84 based EPSG:4326.
The map interface is built on top of the Leaflet interface with most of the original functions still present, including dragging and zooming. In addition to the normal interface you can single click on map inside the shader to center the map in that position (there's a bit of a delay). However, to provide a better appearance, the map background is not the original OpenStreetMap background, but rather, ESRI World Street Map
Before proceeding you should be aware that, because of the nature of the projection, the map window will not work as expected in high latitudes (above 85°): The closer values get to 90°N the more shaders and event locations will be distorted.
- Search area shader.
- Event circles.
- Event infoboxes.
- Simple legend showing some event circle sizes for reference.
The search area shader, which is the green-tinted circle in the picture above, is the key element for searching: Basically whenever you hit the Search button you'll locate events under the shaded area (or everywhere if you have ignore location set).
You can drag or click the shader itself to change the search location and recenter the map. (nb. none of this applies to box search mode).
After conducting a search your map should in most cases have some event circles, which are the red circles in the picture above. The size of the circle depends on the event's magnitude, but the size of the event circle itself has no physical meaning (for example, it is not radius of destruction or anything). If the event is acquired from preliminary data, the event circle will be tinted orange.
Not all the event circles will be red. Depending on the event the circle can also be green, which means no magnitude info is available, or purple, which means that the seismic origin of the (historical) event is questionable.
If you want a quick glance you can just hover the cursor above an event circle. This will display a one line description of the event below the cursor.
Note that only those events that are currently displayed on the result list will have an event circle on the map.
- Top half, which basically contains the position, time & date information of the event. It might also contain some other additional information in case the event is somehow special.
- Lower half, which contains information describing the event from magnitude and focal depth to positioning information (only for more modern events).
If an event has multiple different magnitudes measured (eg. by different instance and/or method) then the magnitude displayed on the infobox is the maximum magnitude measured. However, this is not necessarily the magnitude that describes the event best. You can examine the raw data to find alternative magnitudes (if any).
In case you're wondering, Az. gap – Azimuth gap – describes how many degrees is the biggest gap between two seismic stations used in locating, eg. if one station is north, one is east and one is south of the event then the Az. gap would be 180°. Min. dist on the other hand gives the minimum distance to a seismic station used in locating the event.
- Export Raw button allows you to copy to clipboard the raw data of the event exactly as it is in catalogue. See also the description of raw data.
- Jump to list button scrolls the browser window to the event's position in the result list.
Results
After the map and the visualization it offers, this section is probably the most important part of the page, especially the result list which displays the results. As with most components, how the results will look like vary based on the screen width and browser.
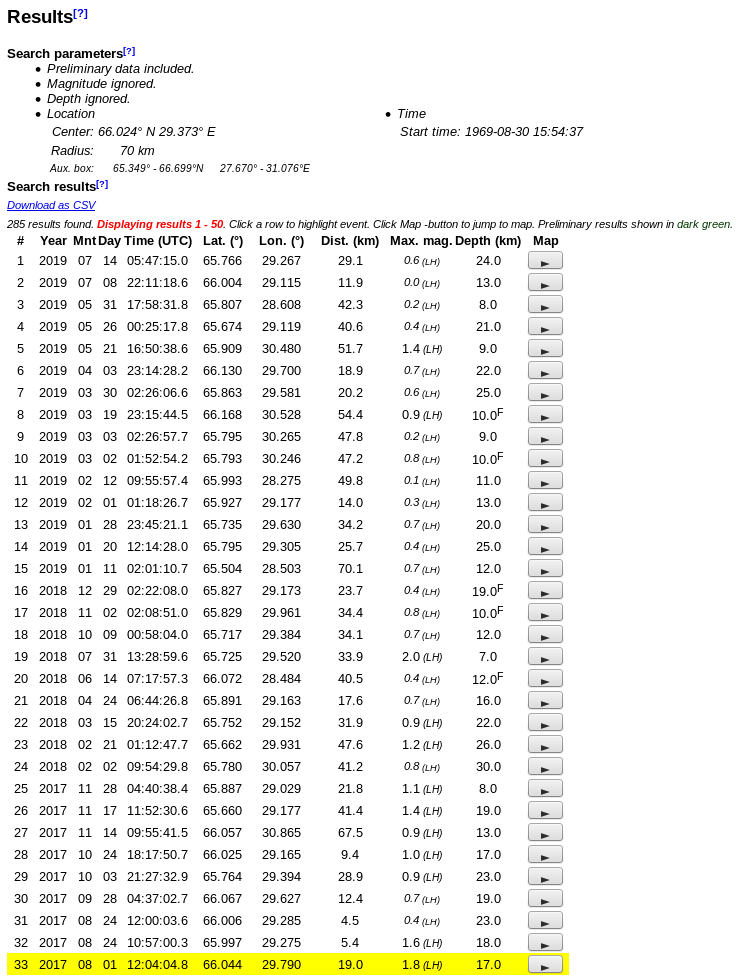
The picture above shows what the results will look like on a typical viewer with an event highlighted. The only missing column on the displayed result list is the raw data column, which contains all the information about an event stored in the catalogue. You can still view the raw data of an event by using the Export Raw button on the event's infobox interface (see also map).
In case you haven't completed a proper search, like after pressing the update button, then the results will only show a No valid search done! notification.
Back to topSearch parameters
Search parameters contains, as the name suggests, the parameters of the search you conducted.
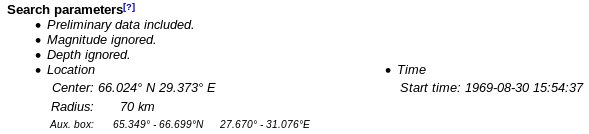
Basically it's the first place to look at if you suspect the search didn't complete succesfully. You should always check the parameters and then check the typing if there's something wrong with the results. In particular, getting the time range right can be tricky and you can easily end up with a range completely different from expected.
The search parameters will also display a message if a parameter is ignored, eg. Magnitude ignored instead of a magnitude range.
If your screen is wide enough then the search parameters will be displayed horizontally. However this has no impact on the content of the section.
Back to topExportable CSV
So you conducted a search and want to save or view the results on your own spreadsheet program? Just click the Download as CSV button.

Clicking the button will export the full search results – ie. all the pages of the result list – into a CSV file named results.csv which you can then save on your computer. This might result in a file size in order of several megabytes so be patient when downloading the file.
- Items are seperated by a comma (,).
- Decimal separator is the period (.).
- First row contains the column headers without quotes.
- Raw data of an event enclosed in quotes (").
The data that is stored into the CSV seperately are the event's timing – in the year, month, day, hour, minute and second columns – location, the maximum magnitude info (magnitude & magnitude type) and depth (0 if no depth available). CSV will also contain the event's raw data, which you can use to extract other information about the event.
Back to topResult list
The result list will contain the results of a succesfully completed search. What it displays or leaves out – depending on things like the configuration or browser width – is explained here.
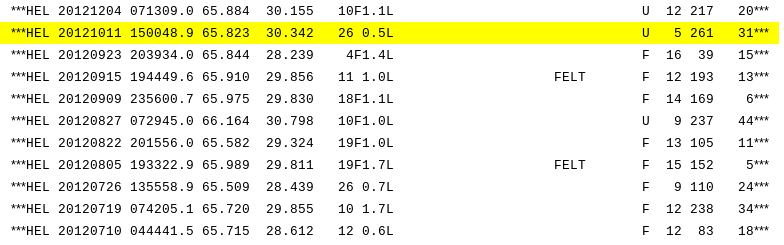
The result list you see above contains the values you can normally expect to see, excluding the raw data column. In addition to normal copy/paste functions you can also highlight a row by clicking it (the yellow row in picture), which centers the map to an event and opens up its infobox (see also the Map section).
On top of the list, after the Download as CSV link which is described above, there's a short summary of the search including the number of results found and what results are displayed on the current page. There's also a short help text and in case catalogue only check box (see configuration) isn't checked then a notification about possible preliminary results, which might be included on the result list (notice the greenish items on the list in the picture).
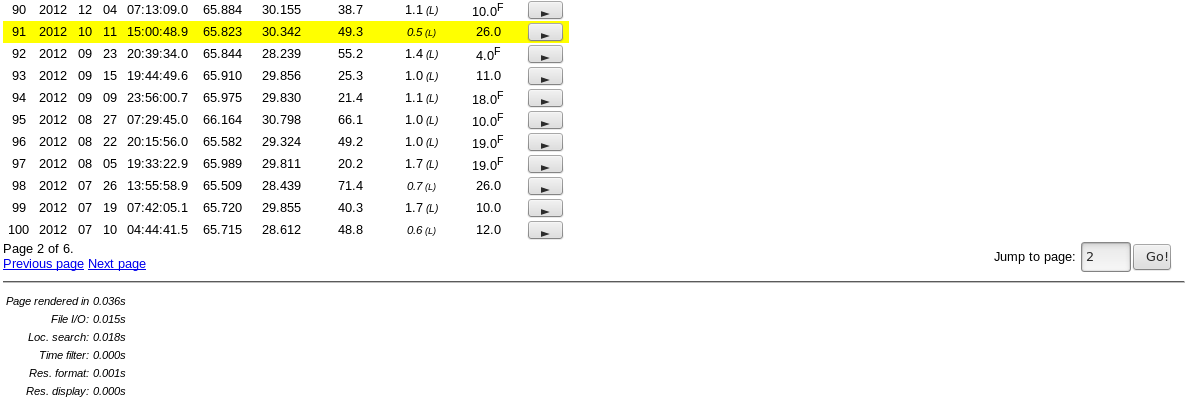
Below the result list lie the page controls in case the search returns more results than what the results per page setting is in the configuration. Previous page jumps to the previous page and Next page to the next possible page. In case the result list is really long, I recommend using the Jump to page text box and the Go button on the right to navigate the pages: In order to enter a new page, just click the textbox, type the desired page number and press Go button (ps. instead of clicking the button you can in fact click anywhere or even press enter to jump to page).
Only those events that are currently displayed on the result list have event markers on the map. You can control the displayed events by, obviously, changing the page and also by changing the results per page setting in the configuration.
The result list itself is roughly organized in descending age order, ie. with the oldest event displayed first. There might be some variation, due to the source data being in wrong order, but in general you can rely on more modern events being nearer to the end of the list.
The items that are displayed on the list depend on what data is available. Infact only the Year, Lat., Lon. and Raw data columns are guaranteed to be filled. In case an event doesn't have appropriate data available it's denoted by a – (date/time) or N/A (magnitude).
- # – Running index. Serves no other purpose or physical significance.
- Year, Mnt, Day – Date of the event.
- Time – UTC time of the event. Accuracy up to tenths of a second for recent events.
- Lat., Lon. – Event's latitude and longitude, ie. position of the event, in decimal degrees.
- Dist. – Distance of the event to the search location, which is also the center point of the search shader. Not available in box search mode.
- Max. mag. – Maximum measured magnitude of the event. The additional letters in parentheses describe the type of the magnitude (see also raw data). The styling of the magnitude tells about the event's size: Bigger event has more noticable number.
- Depth – Depth of the event in kilometers. If the depth is followed by a superscript 'F' (ie. F) then the depth has been set manually instead of being the raw measured depth.
- Map – A button which, when clicked, highlights the row and zooms to the event on map.
- Raw data – Raw data of the event. See raw data.
As you might have noticed, some of the items on the column list above have a square instead of a disc in front of them. This signifies a column that might be missing if the window width gets below a certain limit. Raw data column is the first to go with a required width of ca. 1500 pixels, it is followed by Dist and # columns. The final item to go is the magnitude type info at ca. 500 pixels.
Back to topRaw data
The raw data text string contains all the data that is stored into the catalogue about any single event. On the result list event's raw data is enclosed by three asterisks (***) for clarity because the raw data is character location sensitive.
First thing to notice is that because the catalogue reaches back almost 7 centuries (first event recorded in the catalogue is from 1375) most of the events will have incomplete information. Furthermore more modern events have different data available compared to historical events. As a consequence the raw data block will have a lot of blank spaces and it's length will vary.
| Position | Format | Description | Example |
|---|---|---|---|
| 1-3 | 3 letters | Source information | HEL – Univ. of Helsinki Institute of Seismology |
| 4 | Blank or ? | Uncertain event | ? – Seismic origin of the event is questionable. |
| 5-12 | YYYYMMDD | Date | 19120304 – Day 1912–03–04 |
| 13 | 1 character | Event type | r – Mining induced seismic event. |
| 14-21 | HHMMSS.s | Time (UTC) | 050607.8 – Time 05:06:07.8 (UTC) |
| 22-28 | Float (7.3) | Latitude north to 3 decimal precision | 67.786 – Lat: 67.786N° |
| 29-36 | Float (8.3) | Longitude east to 3 decimal precision | 18.793 – Lon: 18.793E° |
| 37-38 | 2 characters | Uncertainties of time & position (for older events) | AA – Under 15 minutes and under 0.2°. |
| 39-41 | Integer (3) | Focal depth, 'depth of the event', in km | 12 – Depth of 12 km. |
| 42 | 1 character | How the depth was determined | F – Fixed, ie. manually set while positioning. |
| 43-45, 48-50, 53-55 | Float (3.1) | Event magnitudes from different methods and/or instances | 1.4 – Measured magnitude of 1.4. |
| 46-47, 51-52, 56-57 | 2 characters | Method used to measure/estimate (and the instance measuring) the magnitude. | Wu – Moment magnitude method; measured by Uppsala. |
| 58-66 | Blank | ||
| 67-70 | Roman numeral (4 characters) | Maximum macroseismic intensity of the event (usually for older events) | VII – Class 7 event, moderate damage to buildings. |
| 71 | 1 character | Macroseismic description | * – Macroseismic map exists. |
| 72-74 | 3 letters, ? or IV | Macroseimic reference, uncertain felt area or IV-isoseismal area follows | IV – Radius of class IV macroseismicity follows (rare code). |
| 75-77 | Integer (3) | Mean radius of perceptibility in km | 75 – Noticable within 75 kilometers of the epicenter. |
| 78 | 1 character | Region code | F – Finland |
| 79-82 | Integer (4) | Number of stations used in locating the event | 25 – 25 stations used in positioning. |
| 84-86 | Integer (3) | Maximum azimuth gap in degrees | 166 – Maximum of 166° degrees between 2 positioning stations. |
| 87-91 | Integer (5) | Minimum distance from an event to a station used in locating | 14 – 14 kilometers to the nearest positioning station. |
| 92– | Varies | Preliminary events might have extra data. |
Page footer
This actually doesn't have much to do with results, but without a proper search it's dull to read with exactly one line of text with something like Page rendered in [really small number]s.

The page footer lists the rendering times of the page. The reason why it's in the manual at all is that by looking through the items you can see what searches or filters were actually conducted.
The displayed times will only include stuff the server has to do, so it does not include the map because that's rendered on the client's computer. This means that even if it seemingly would take seconds to display the page, the actual rendering times might be under a tenth of a second.
Back to topFAQ
Here are answers to a couple of common questions and some search tips.
- Under Location set the Ignore location checkbox.
- Under Magnitude set the Ignore magnitude checkbox.
- Under Time range set Start time to -4 weeks while leaving End time empty.
In case the search returns more than 50 events, you might want to increase results per page option under the Configuration as well (see also the next question).
There are a couple of ways of handling the problem:
- The simplest one would be to accept paging and browse through the results page by page.
- You could also increase the Res/pg under the Configuration section of search. However, caution is adviced: If you select All and the amount of displayed results is high enough (around & over ~1000) then the browser might crash while trying to add the event circles.
- Finally, if displaying the map is not important, you could click the Download as CSV-link. This way you'd get the full list of results in a CSV format.
The quake might also be too small for proper positioning or outside the network the Institute of Seismology uses (ie. too far away), for example the map won't show a quake that happened in Japan.
Also, make sure the quake is contained within the search parameters. This is especially important if the event happened just now, in which case make sure the Time range begins from eg. Now, instead of Today.
Easiest fix is to move the circle/rectangle back to lower latitudes. If you have not performed search or update, you may use Reset to prev. button which resets the search parameters and recenters the map to the previous search or update. Alternatively you could try refreshing the page, retyping the address or even manually modifying the location and pressing the Update button.
If that doesn't fix the issue, then it could be related to some server issue, in which case your best bet is to wait.
In case you input at least one search parameter, then double check its/their validity. My guess is that the input format is invalid somehow (eg. wrong type of decimal seperator or something arcane like that). Be especially careful when inputing the date.
Perhaps the easiest is to mark Ignore location and Ignore magnitude, while setting the start time to something like -1000 years.
Naturally, similar approach works with other options as well.
- Kouvola earthquake swarm
Latitude: 60.905°N
Longitude: 26.687°E
Radius: 3 km
Magnitude range: Ignore
Time range: December 2011 - January 2012
Res/pg: 200